Genomic instability is a hallmark of cancer and targeting its mechanisms has helped inform effective therapeutic strategies1,2. However, there are limitations with current methods of genomic instability assessment. Here, we explore genomic instability in the context of homologous recombination deficiency and the value of deep learning-based methods of detection.
What is genomic instability and how is it caused?
The DNA in our cells endure up to one million damaging events each day, caused by both exogenous (i.e. environmental) and endogenous (i.e. internal metabolic) factors3. These events activate a complex network of DNA damage response (DDR) pathways, which facilitate DNA repair and maintain the stability of the genome4. Mutations and/or dysfunction in DDR pathways can lead to unrepaired DNA damage, resulting in genomic instability4.Genomic instability, in turn, increases the cell’s propensity for genetic alterations that cause cancer initiation and progression4,5.
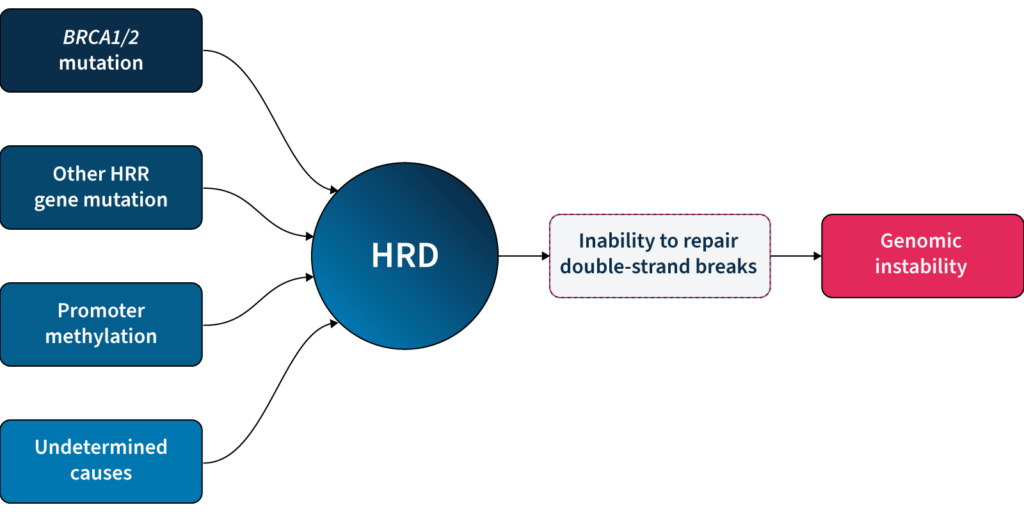
One of the major DDR pathways is the homologous recombination repair (HRR) pathway, responsible for repairing double-strand breaks (DSBs) in DNA5. Loss of function in HRR, known as homologous recombination deficiency (HRD), causes cells to rely on error-prone DNA repair pathways, resulting in the accumulation of genetic aberrations that lead to genomic instability5 (Fig 1). HRD is a well-established prognostic and predictive biomarker in different cancer types (e.g. ovarian, breast, prostate, and pancreatic)5–7.
Why is it clinically relevant to measure genomic instability?
HRD-positive tumors are sensitive to targeted inhibition of poly-ADP ribose polymerase (PARP), key proteins involved in DSB repair7. By blocking PARP, the HRD-positive cell can no longer rely on error-prone pathways for DSB repair and the cell dies, a process known as ‘synthetic lethality’5,6. PARPi therapy has revolutionized the management of HRD-positive patients with advanced ovarian cancer, significantly improving progression-free survival when used as a first-line maintenance therapy8. PARPi therapies also have approved indications in breast, pancreatic and prostate cancer9, with trials underway in other cancer types, such as colorectal10.
Based on the predictive value of HRD status for PARPi benefit, clinical guidelines recommend HRD testing in patients with advanced ovarian cancer7,11,15. HRD status can be determined by examining 1) the underlying causes of HRD, and 2) the effect of HRD, i.e. genomic instability5,7. The most well-known causes of HRD are loss-of-function mutations in HRR genes, including BRCA1 and BRCA25,7. However, loss-of-function in HRR genes is diverse amongst patients12, making patient stratification solely based on genotyping challenging. Also, approximately 30–40% of HRD cases are due to unknown causes13,14. Measuring genomic instability allows the assessment of HRD, regardless of its underlying etiology5,7.
Genomic instability status can help identify a sub-group of women who are BRCA wild-type but may still derive benefit from PARPi therapy15. By measuring genomic instability, clinicians and researchers can therefore go beyond HRR mutation detection and expand the potential benefit of PARPi in patients.
How is genomic instability measured?
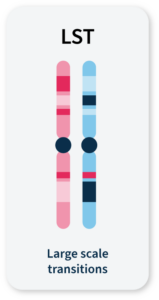
Many methods for measuring genomic instability rely on the identification of specific mutational signatures or genomic ‘scars’ associated with large-scale structural rearrangements in chromosomes. In HRD-positive cancers, the characteristic genomic scars are loss of heterozygosity (LOH), large-scale state transitions (LST), and telomeric-allelic imbalance (TAI)16–18.
Click the boxes below to learn more:
LOH
A cross-chromosomal event that results in loss of part of a gene or entire gene(s) and the surrounding chromosomal region.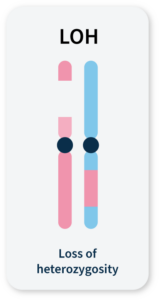
LST
Chromosomal breaks between adjacent regions of at least 10 Mb.
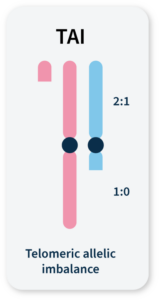
TAI
Accumulation of a discrepancy in the 1:1 allele ratio at the end of the chromosome (telomere).
The combined number of LOH, LST, and TAI events generate a genomic instability score (GIS) that reflects the level of genomic instability. Some commercially available HRD tests combine tumor BRCA mutation testing with a GIS5,19. Methods that integrate multiple genome-wide signatures (e.g. HRDetect) are among the most promising for detecting HRD status7,20. However, both GIS and HRDetect methods require deep genomic profiling data (>30x coverage), which can be costly and difficult to implement in routine analysis.
Alternative approaches that rely on the detection of copy number changes from WGS at low (~1x) sequencing depth (low-pass WGS) can predict tumor HRD status21,22 and provide an affordable and easy-to-implement HRD detection method. However, the sensitivity of existing methods that solely rely on this type of genomic scar to identify HRD samples is limited, and their utility in a clinical context remains untested22.
Unlocking the full potential of low-pass WGS in HRD detection requires going beyond the enumeration of biomarker events and examining alternative features of the cell that can result from genomic instability.
GIInger™: A deep learning approach to genomic instability measurement
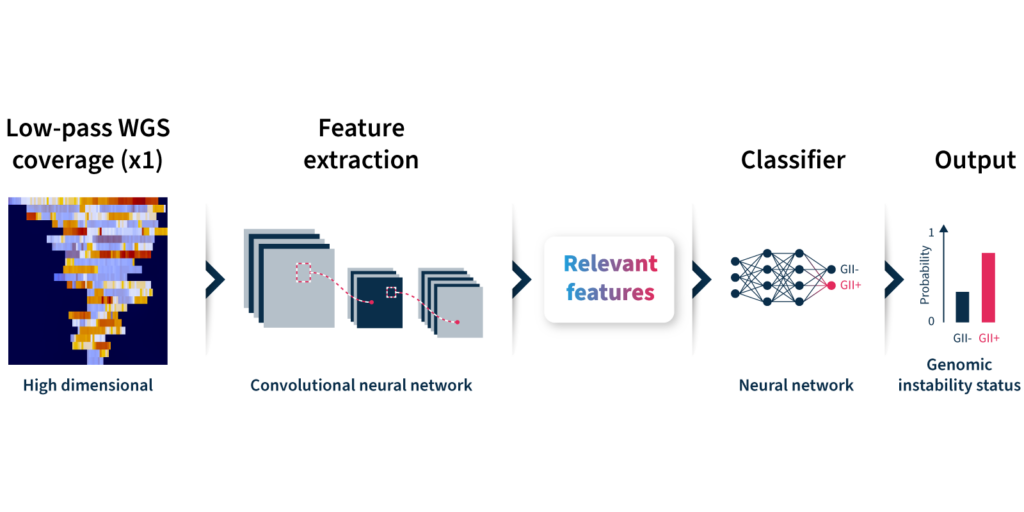
To overcome the limitations of current genomic instability measures, our expert team at SOPHiA GENETICS developed the GIInger™ algorithm exclusively available on the SOPHiA DDMTM Platform. GIInger™ is a deep learning-based approach to measuring genomic instability in ovarian cancer samples. Rather than relying on the enumeration of biomarkers events, GIInger™ leverages differences in the spatial distribution of genomic scars in low-pass WGS coverage profiles23.
Let’s take a closer look at how the algorithm predicts genomic instability status (Fig 2):
- Input: GIInger™ uses coverage profiles from low-pass WGS data, requiring only ∼1x coverage depth (minimum ∼0.4x).
- Convolutional neural network (CNN): Coverage profile features are extracted and passed through a CNN that has been trained on a sample data set to classify genomic instability.
- Output: The GIInger™ model produces a Genomic Integrity Index (GII) which is predictive of a sample’s genomic instability status.
Unfamiliar with deep learning terminology? Read our guide on machine learning jargon.
By adopting GIInger™ into next generation sequencing (NGS) workflows, clinical researchers can benefit from an in-house, affordable approach to genomic instability measurement. The SOPHiA DDM™ Platform offers applications that enable laboratories to easily implement GIInger™ into their routine NGS analysis:
- SOPHiA DDM™ HRD Solution (also available as CE-IVD-marked application): A HRD detection solution that combines targeted sequencing panel of 28 HRR genes, including BRCA1 and BRCA2, with GIInger™ in a single end-to-end workflow.
- SOPHiA DDM™ GIInger Genomic Integrity Solution: A bioinformatic pipeline for prediction of genomic instability status in samples. Designed to analyze WGS data, this solution offers a flexible approach to genomic instability measurement that can complement capture-based BRCA assays for a complete HRD assessment.
Want to see how GIInger™ can help maximize insights from your data? Get in touch with our team and request a demo.
References
- Hanahan D, Weinberg RA. Biological Hallmarks of Cancer. in Holland-Frei Cancer Medicine 1–10 (John Wiley & Sons, Ltd, 2017). doi:10.1002/9781119000822.hfcm002.
- O’Kane GM, Connor AA, Gallinger S. Trends Mol Med. 2017;23:1121–1137.
- Clancy S. Nature Education. 2008;1(1):103.
- Wang M, Chen S, Ao D. MedComm. 2021;2(4):654-691.
- Ngoi NYL, Tan DSP. ESMO Open. 2021;6(3):100144.
- Mekonnen N, Yang H, Kee Shin Y. Front Oncol. 2022;17;12:880643.
- Miller RE, Leary A, Scott CL, et al. Ann Oncol. 2020;31(12):1606–22.
- Ray-Coquard I, Pautier P, Pignata S, et al. N Engl J Med. 2019;381(25):2416–28.
- Ragupathi A, Singh M, Perez AM, et al. Front Cell Dev Biol. 2023;11:1133472.
- Clinicaltrials.gov. NCT05201612. https://clinicaltrials.gov/ct2/show/NCT05201612
- Armstrong DK, Alvarez RD, Backes FJ, et al. J Natl Compr Canc Netw. 2022;20(9):972-980.
- Lord CJ, Ashworth A. Science. 2017;355:1152–1158.
- Nguyen L, Martens WMJ, Van Hoeck A, Cuppen E. Nat Commun. 2020;11:1–12.
- Davies H, Glodzik D, Morganella S, Yates LR, Staaf J, Zou X, et al. Nat Med. 2017;23:517–52.
- Colombo N, Ledermann JA. Ann Oncol. 2021;32(10):1300-1303.
- Abkevich V, et al. Br J Cancer. 2012;107:1776–1782.
- Birkbak NJ, et al. Cancer Discov. 2012;2:366–375.
- Popova T, et al. Cancer Res. 2012 ;72 :5454–5462.
- Timms KM, et al. Breast Cancer Res. 2014;16;475.
- Davies H, et al. Nat Med. 2017;23:517–525.
- Eeckhoutte A, et al. Bioinformatics. 2020;36:3888–3889.
- Pratto F, et al. Science. 2014;346:1256442.
- Andre G, et al. BioRxiv preprint. 2022. https://www.biorxiv.org/content/10.1101/2022.07.06.498851v2.full.pdf