Accelerated interpretation of exome sequencing data with SOPHiA DDM™ and Alamut™ Visual Plus
At SOPHiA GENETICS we aim to bring clarity to
rare and inherited disease analysis.
The combination of SOPHiA DDM™’s advanced exome analytics with the variant interpretation and visualization capabilities of Alamut™ Visual Plus provides you with a comprehensive understanding of your variants.

5 easy steps from data to report
Step 1: Alignment and variant calling
Pipelines optimized to your sample type, chemistry, enrichment kit, and sequencer
Single- or multi-sample (trio) analysis
Advanced accuracy across multiple variant types in a single experiment, including CNVs
High sequence coverage uniformity even in complex and GC-rich regions
Detailed quality metrics
Step 2: Dynamic filtering
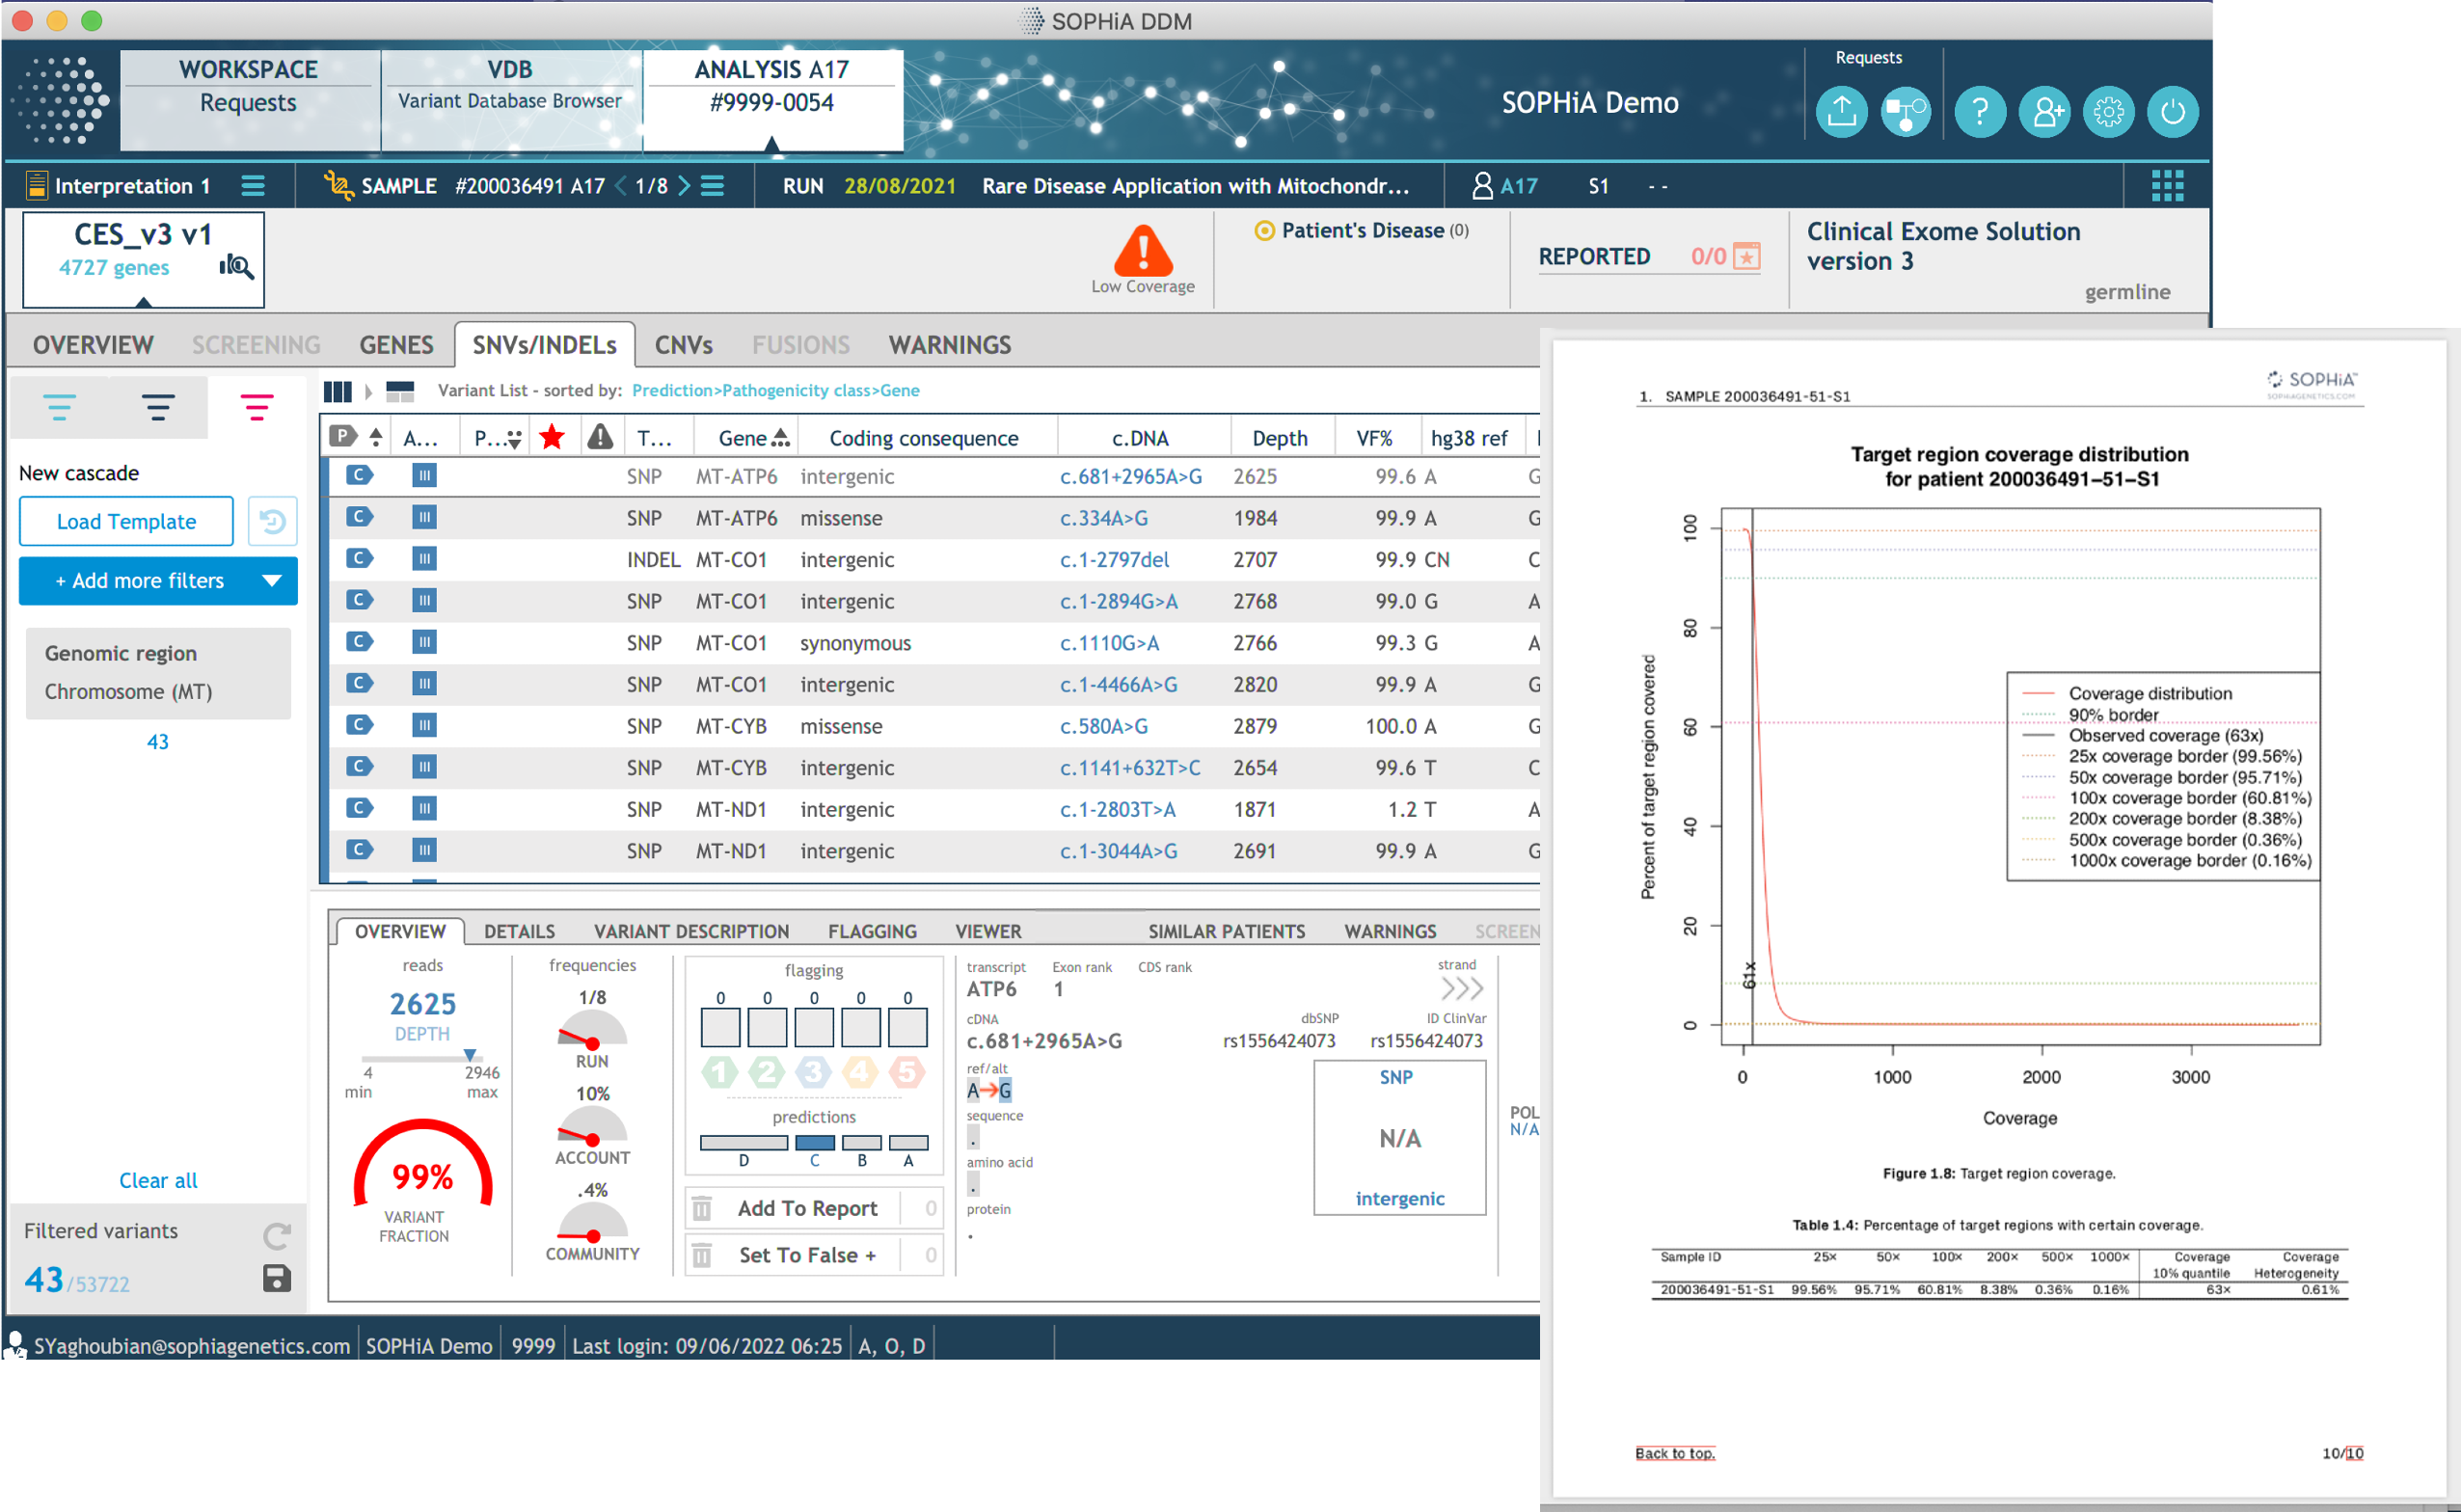
Virtual Panels automatically select genes associated with specific diseases through integrated databases
Familial Variant Analysis displays variants in each family member in SOPHiA DDM™, with the option to filter according to inheritance mode
Cascading Filters allow custom strategies to be set up in a few clicks using filters such as variant classification scans
Step 3: Enhanced annotation and visualization
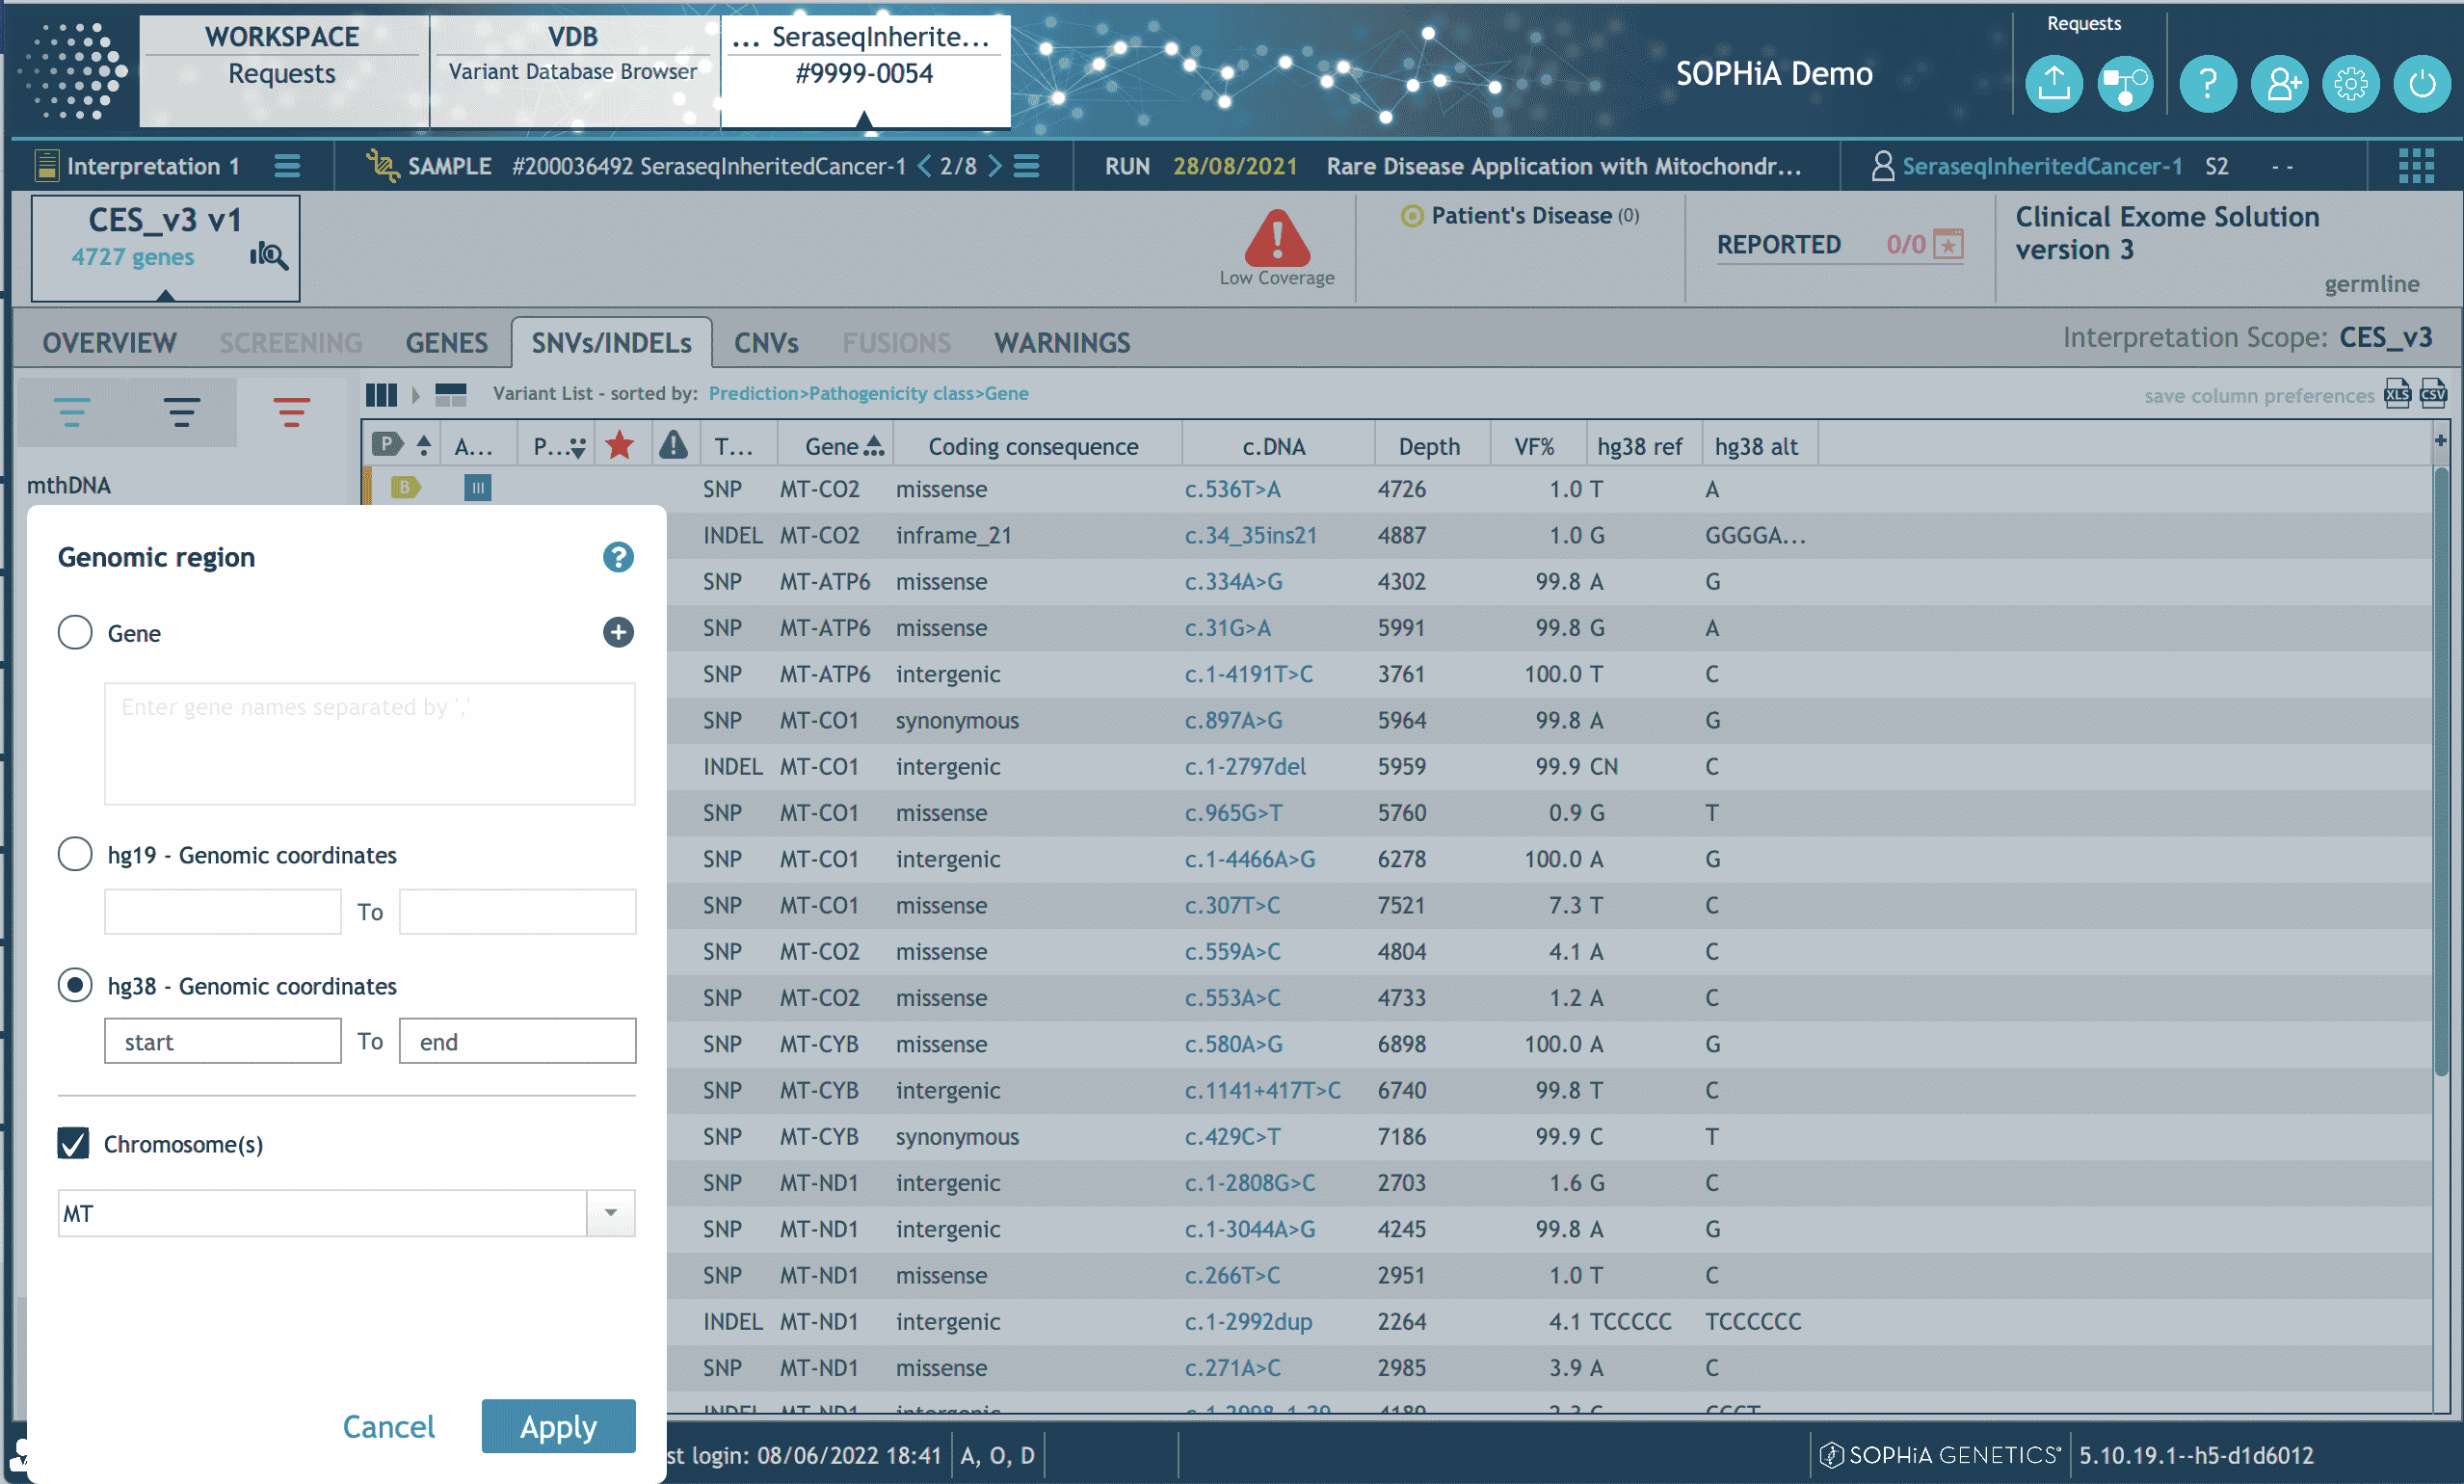
Comprehensive annotation with up-to-date information from >55 world-renowned curated databases, guidelines, and missense and splicing predictors
Variant exploration on a genomic scale in a comprehensive, full genome browser
Visualization of variants in GRCh37/38 assemblies and the mitochondrial genome, displaying flanking regions and overlapping genes
Step 4 : Variant Confirmation
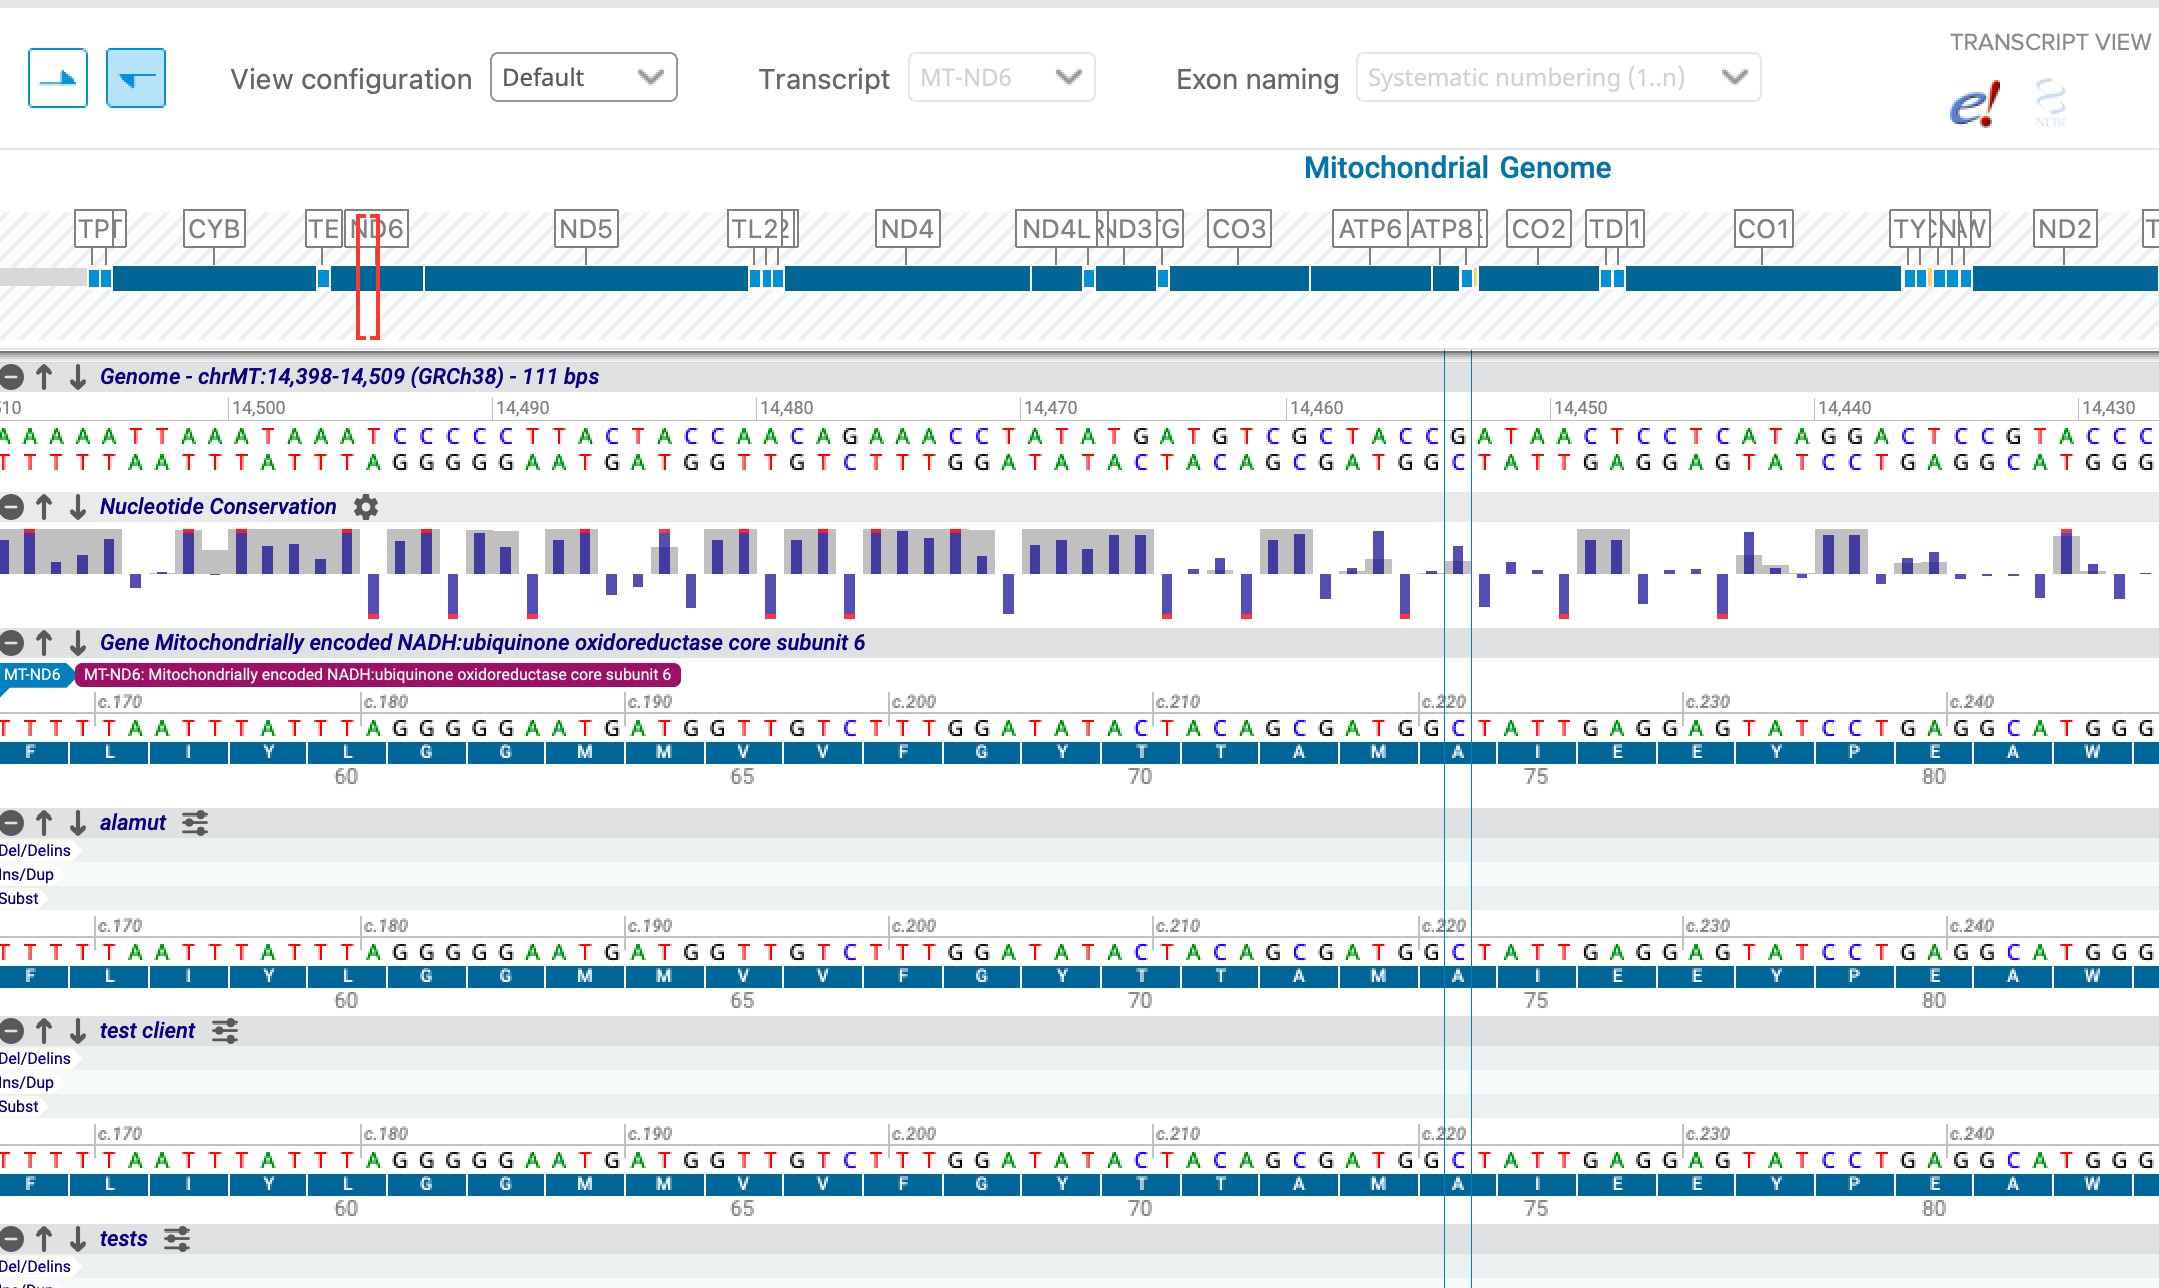
Intuitive user-friendly interface
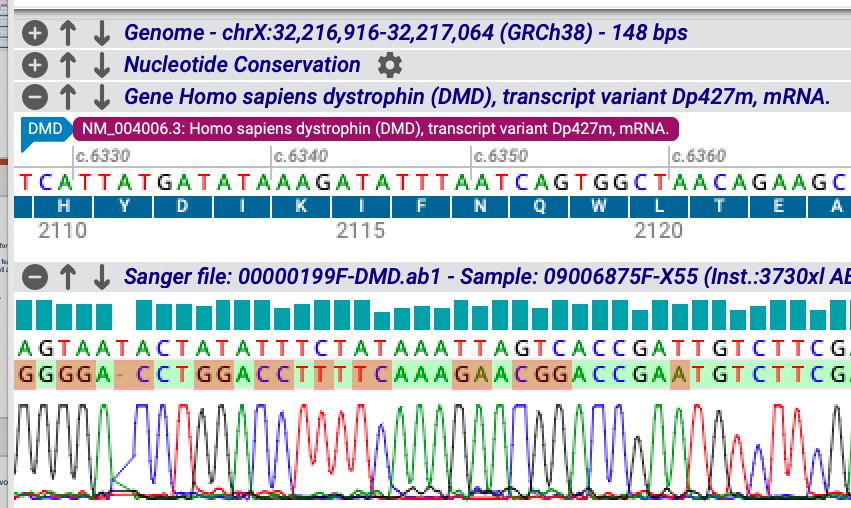
Sanger sequencing and BAM read alignment tracks
Supporting database tracks on the genome browser
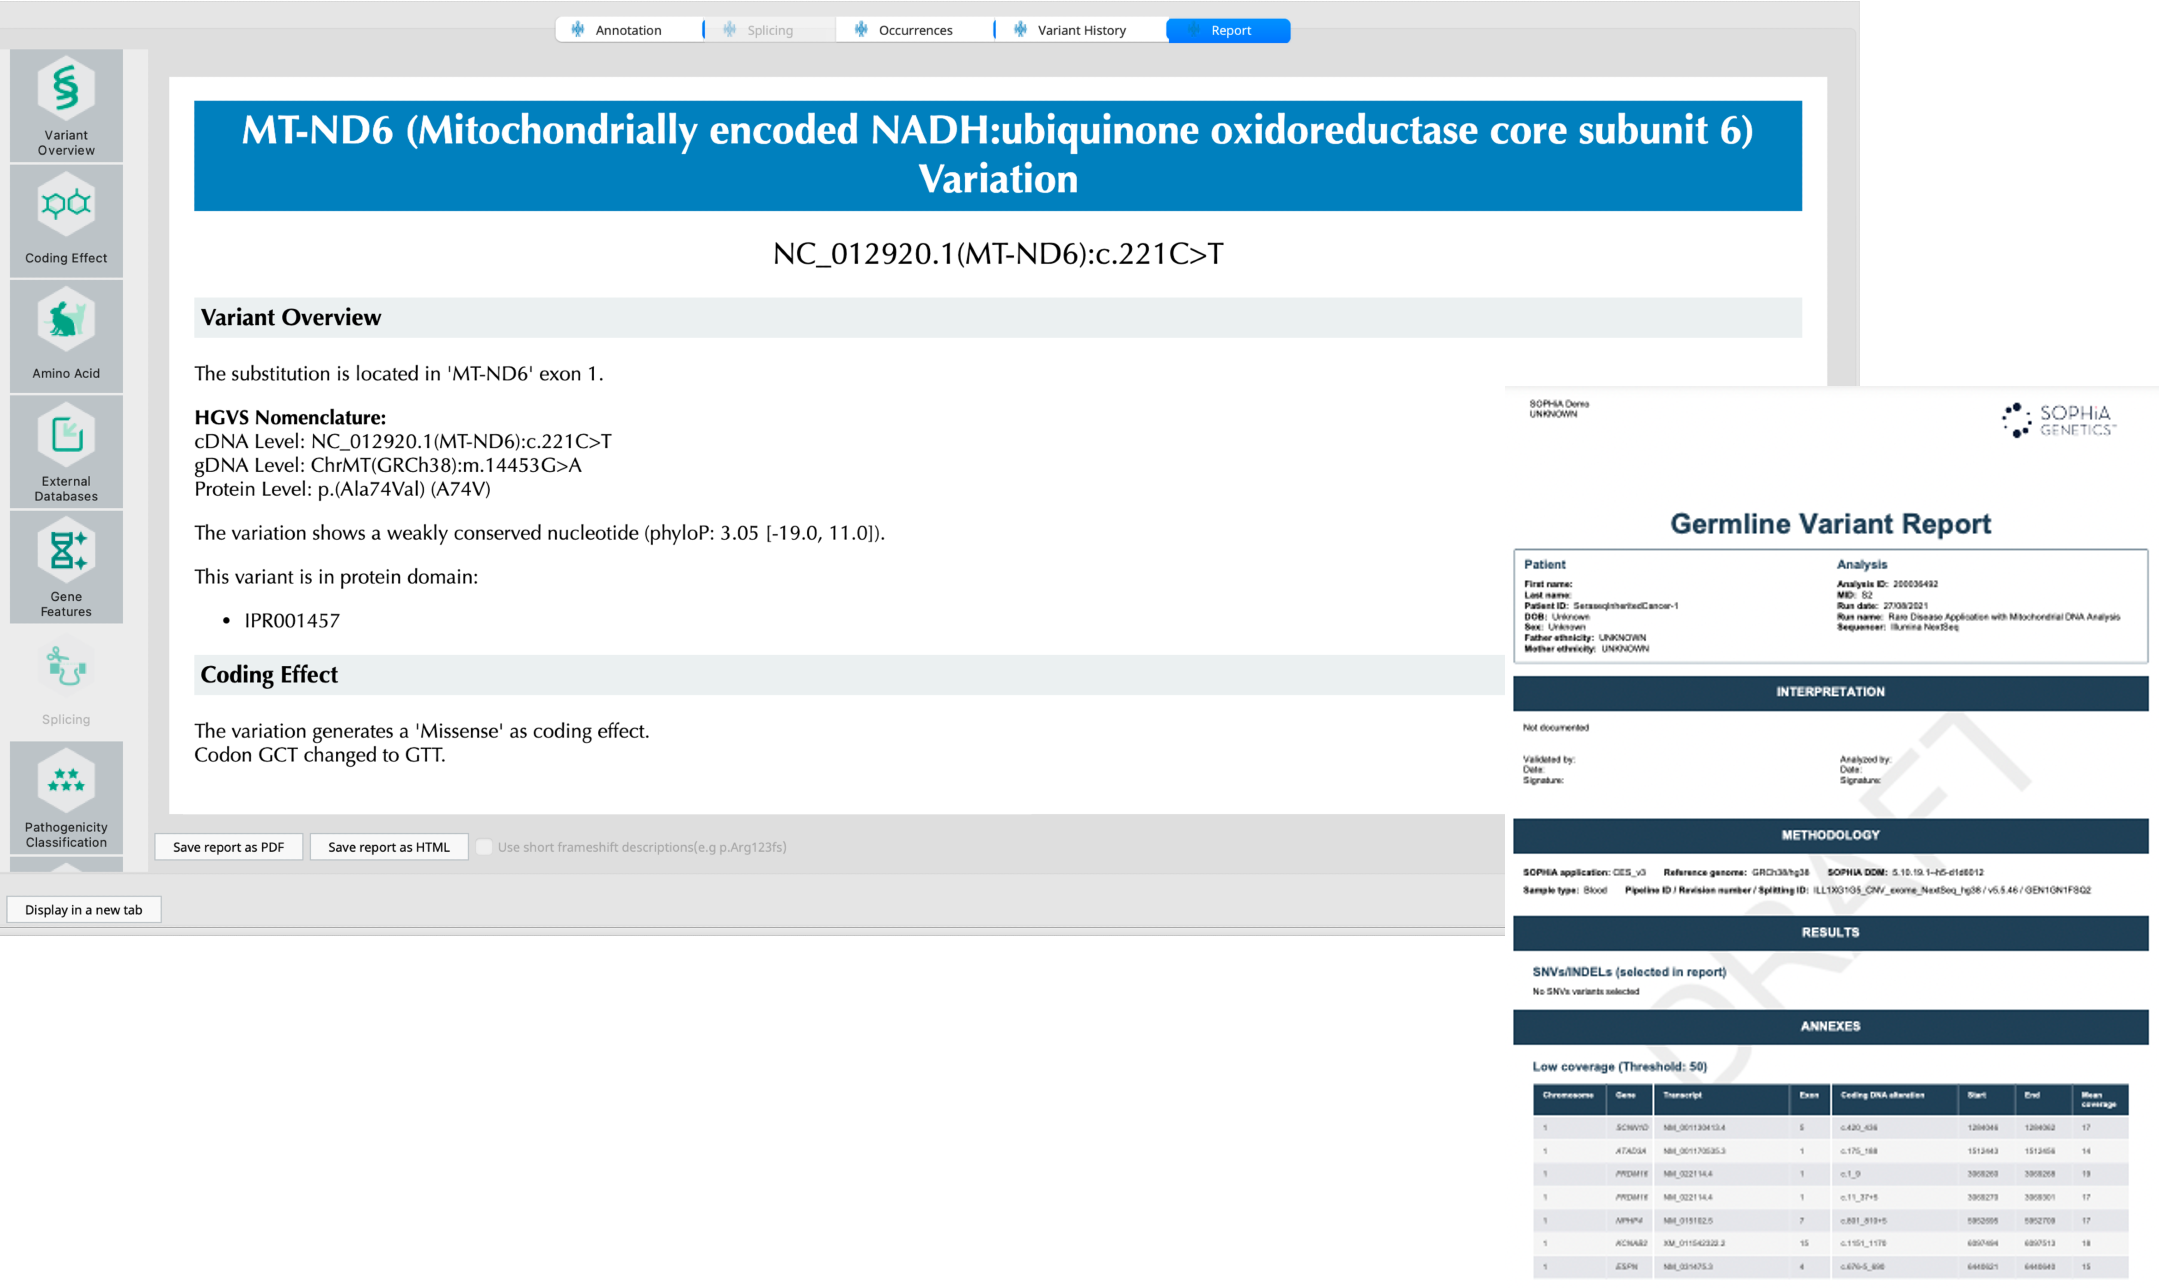
Step 5 : Reporting
User-driven templates for customization
User friendly
Guideline-driven information for decision making
